Updates baramundi Argus Cockpit

Argus Cockpit update history

Details on all updates to baramundi Argus Cockpit

Feature updates for baramundi Argus Cockpit (bAC) are described below in chronological order.

Stay up to date: Bookmark this list in your browser or access it directly from the bAC.
 

February 2023

New functionality for multi-site IT environment and user role management

Environment roles and tags enable targeted control of permissions for individual site admins

Argus Cockpit received an update with the 2022 R2 release giving IT admins the ability to create and invite users and assign them rights. This also allows enterprise admins to assign multiple bAC environments to individual site admins and customize user details.

It is also now possible for IT admins managing multiple sites to keep track of them as digital environments and customize environment details such as the environment name.

Want to ensure that each user can only perform certain actions and see specific content?

By assigning environment roles, access rights can be set individually. This works for both smaller and larger teams.

Pünktlich zum neuen Jahr gab es mit dem Release 2022 R2 ein Update für Argus Cockpit. IT-Admins haben jetzt die Möglichkeit Benutzer anzulegen, einzuladen und diesen Rechte zuzuweisen. Dadurch ist es auch möglich, dass Unternehmens-Admins einzelnen Standort-Admins mehrere bAC-Umgebungen zuordnen und Benutzerdetails anpassen. Auch den IT-Admins, die mehrere Standorte verwalten ist es nun möglich, diese als digitale Umgebungen im Administrationsbereich im Auge zu behalten und Umgebungsdetails wie z.B. den Umgebungsnamen anzupassen.

Sie wollen sicherstellen, dass jeder Nutzer nur bestimmte Aktionen durchführen und spezielle Inhalte sehen kann?

Durch die die Zuordnung von Umgebungsrollen können die Zugriffsrechte individuell abgedeckt werden. Das funktioniert sowohl für kleinere als auch für größere Teams.

Sie sind Partner von baramundi, verwalten mehrere Kunden mit einem oder mit mehreren bMS-Servern und wollen Ihren Kunden Zugriff auf jeweils eigene Daten und Sichten ermöglichen?

Mithilfe von "Tags" können Sie Ihre Kunden den Universellen Dynamischen Gruppen (UDG) zuweisen. Diese konnten bisher nur als Gesamtes aktiviert oder deaktiviert werden. Jetzt kann durch das Setzen und die Vergabe von Tags der Zugriff auf einzelne UDG flexibel und sicher gesteuert werden.

You are a partner of baramundi, manage several customers with one or more bMS servers and want to give your customers access to their own data and views?

You can use "tags" to assign your customers to Universal Dynamic Groups (UDG). Previously, these could only be activated or deactivated as a whole. Now, by setting and assigning tags, access to individual UDGs can be controlled flexibly and securely.

May 2022

Identify recurring server service issues, improved performance, UI and security.

History of server status changes makes accumulations of faults visible

Continuous, error-free operation of your baramundi Management Server is the basis for keeping IT environments up-to-date and secure. That’s why it’s essential that IT admins be notified of any interruptions or faults in individual server services.

In this update we enhanced the configuration, activation and clarity of the Argus Cockpit notifications that we introduced in early 2022. In addition, you can now review notification histories to identify and remedy patterns in server faults such as those that occur on certain days or times of day. This release also includes further optimizations to the Argus Cockpit infrastructure and bug fixes.

January 2022

Early email alerts for key events and incidents, plus UI, performance and security enhancements.
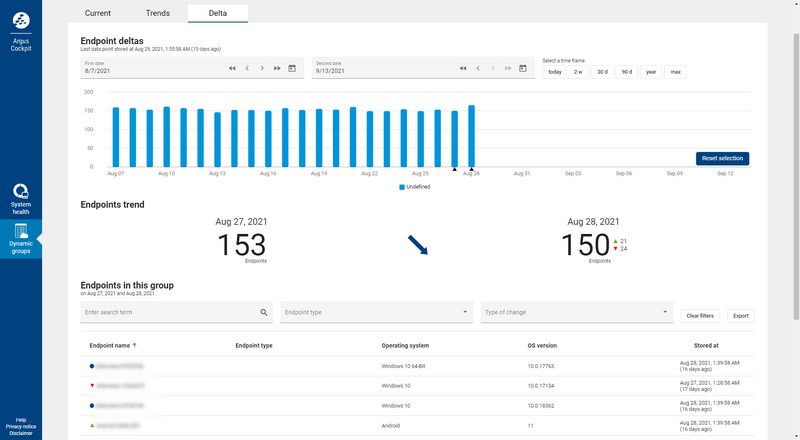
Rapid notification of critical status changes in bMS services or endpoints enable effective responses

Security incidents such as the recent Log4J exploit show the importance of alerting IT managers quickly when critical conditions, events or incidents occur so they can initiate timely and effective responses. baramundi Argus Cockpit continuously monitors and reports the condition of network endpoints. By using UDGs, you can define specific groups of endpoints and conditions to monitor in detail such as BitLocker, firewall or antivirus status, current Windows update level, and many others.


You now also have the option to receive email alerts about critical status changes at an early stage by configuring threshold valuesaccordingly and activating the applicable notifications. Threshold values can be reset or changed as needed at any time.


This release also enables you to configure notifications related to bMS services and (expiring) reporting API keys. It also includes minor UI enhancements (e.g., in breadcrumb navigation) and performance and security optimizations.

October 2021

Delta View: New function for quick comparison of historized data

Comparison of UDG result sets at 2 different points in time

The UDG result sets view has been revised to better distinguish the current data of an IT environment from the historical data. A clear navigation with the help of tabs (as known from bMC) now facilitates the overview. In addition, you have the option in the "Delta" tab to compare the UDG result sets at two different points in time.

This means that you now know not only how many devices were added or removed from one point in time to the next, but also which devices they were, so that you can then trigger specific troubleshooting jobs on these devices (in the bMS).

July 2021

New bAC reporting interface enables detailed reports about your IT environment

Transparency through comprehensive reports on currentness and security

With the new reporting interface in the baramundi Argus Cockpit (bAC), it is now possible to display and evaluate all relevant data from the bAC also in reporting applications (e.g. MS Power BI, MS Excel or similar). As IT admin, you are now able to clearly display accumulated data from the bMS environments connected to the bAC and share them with other positions in the company.

It is also possible for a CISO to use generated reports  to show the current and historic IT system status (e.g. "encryption of all EP activated") during audits or certifications (e.g. data protection audit). Furthermore, as an MSP you can prove compliance with SLAs (e.g. "number of unpatched EPs was always below X EPs in the last month") to your customers.

To make it easier for you to get started with reporting, we also provide you with a standard reporting template for MS Power BI Desktop. However, you are also welcome to use your own templates or those of other customers on our bAC Reporting Template Marketplace.
 

May 2021

(Historical) Export Data from UDG Result Sets to Excel

Improve IT transparency, coordination, reporting and analytics

The new Excel export functionality enables IT admins to share current and historical network and endpoint information with IT managers, CISO and other company managers.

Report data and layouts (e.g. header graphic or footer) can be customized to meet company specifications. For example, current or historical data from UDG result sets (e.g., all end devices with outstanding critical updates, "end devices without BitLocker encryption," etc.) can be distributed to IT staff or used in management reporting and analytics.

MSPs can create customized reports for each customer with relevant data from UDGs defined as needed. For example, data from UDGs can be used to document compliance with SLAs (e.g. "All end devices without outstanding critical updates in the last 4 weeks").
 

April 2021

Display historical data with Argus Trends

Fast anomaly detection: Historization with Argus Trends

One of the distinguishing features of the bMS is that it provides the IT admin with a very good overview of the entire IT environment. It displays current parameters and conditions of end devices so that appropriate actions can be initiated if their ACTUAL state does not correspond to the TARGET state.

It’s also helpful in certain situations to view and analyze the states of the end devices over time. The new Argus Trends feature make this retrospective view possible.

The following historical endpoint information is available in Argus Cockpit:

  • Missing Critical Updates
  • BitLocker Network Unlock Status
  • System Volume BitLocker Status
  • OS Version
  • Last Channel

For example, IT admins can now see how many critical updates have not been installed on one or more end devices in the last 4 weeks. This information is particularly helpful for an upcoming security audit or reporting to the CISO.

December 2020

Individual thresholds for synchronized Universal Dynamic Groups

Set individual threshold values for UDGs

Define thresholds: You can set individual threshold values for each synchronized UDG. UDGs are color coded when the specified values are reached to indicate Job execution status or if additional action is required in the bMS console.
 

September 2020

Assign responsibilities and maintain security when using UDGs

Synchronize Universal Dynamic Groups

We added extensions to the bMC to synchronize up to 10 universal dynamic groups (UDG) with the baramundi Argus Cockpit. UDG can be activated in the synchronization menu.

For added clarity, synchronized UDG are shown with a different menu icon and UDG names are displayed to identify each one quickly.

To maintain data privacy and appropriate admin access rights you may want to specify or limit the ability of bMS users to enable UDG syncing. We added a special rights feature to define sync rights in detail.
 

Displaying UDGs in the Argus Cockpit

To increase management flexibility we added the display of result sets of synchronized UDGs. That gives IT admins with authorized access to each baramundi Management Server the ability to see the status of the Jobs in their synced UDGs.

For example, the IT manager can delegate the monitoring and control of Jobs in one or more UDGs to specific IT staff members who use the Argus Cockpit to check the status of Jobs in their assigned UDGs. That way the IT manager is assured that responsibilities for Job monitoring are clearly and appropriately assigned so that they can focus on other tasks.

The “Dynamic Groups” dashboard helps the IT admin view all synchronized UDGs for each baramundi Management Server and their result sets at a glance. Filter and sorting options add clarity and prioritized views of data.

A detailed view option lets Argus users see more information about which endpoints are in a specific UDG. All endpoints that meet the defined criteria are displayed, while filtering and sorting options enable fast display of specific data as needed or preferred.
 

May 2020

The new "baramundi Argus Cockpit" module goes live

View bMS Server health and Job status

The Argus Cockpit allows IT administrators to monitor the performance and "health" of their bMS environment(s) from any internet-enabled device in a clear admin interface.

Time- and location-independent monitoring

The key added advantage of Argus Cockpit is the ability to monitor relevant bMS Server and Job execution status securely without the need to establish a direct VPN connection to the server. Current status data appears in a responsive web dashboard display using a browser on an internet-connected desktop, laptop or mobile device anytime, anywhere, on the go or in the home office.

Secure access to the data in the Argus Cockpit

Information about the "health" of the connected systems is provided via the cloud. Secure user management gives IT managers the ability to ensure that each IT staff member can only see the server or Job data for which they are authorized. User access is controlled via logging in with their e-mail address and self-selected password.

Secure connection of bMS to the cloud

All bMS Server and Job execution data access, transmission and processing is secured using Microsoft Azure AD, Identity Server, baramundi Connect and HTTPS, state-of-the-art components and interfaceswith cloud hosting in the EU.

In the bMC, from 2020 R1and later, IT administrators can select or change which data is synchronized with the baramundi Argus Cockpit at any time in the bMC.
 

Overview of one or more systems

The baramundi Argus Cockpit is multi-tenant capable to enable simultaneous monitoring of multiple IT environments managed with the baramundi Management Suite. IT administrators responsible for multiple locations within their organization, or Managed Service Providers (MS) managing a variety of diverse customer environments can directly monitor the status of all bMS servers from within a single, consistent and clear user interface. The Argus Cockpit displays server performance or Job execution status, indicating if and where action is required and rapid identification and resolution of an error or interruption.
 

Feel free to provide your suggestions for new functions in the bAC here

Provide suggestions and feedback

Download documentation and instructions for the baramundi Argus Cockpit here

To documentation and instructions